At the dawn of the 19th century, naturalist Alexander von Humboldt invented the “thematic map,” pioneering infographics through the likes of maps annotated with zoological life, temperature, elevations, and other data meant to present an area’s “physical phenomena into one image,” according to this profile on Atlas Obscura.
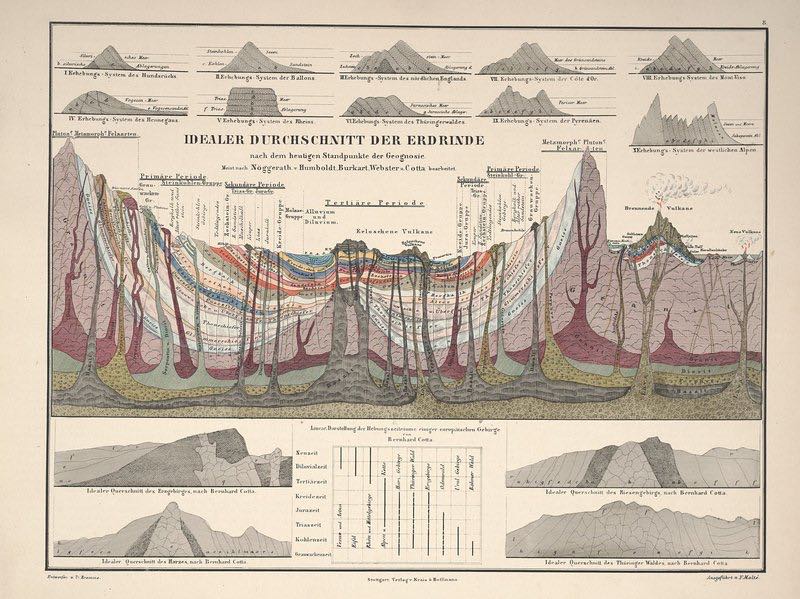
Above, “a plate from Atlas of Alexander von Humboldt’s Kosmos, illustrating the composition of the Earth’s crust via color-coding.”
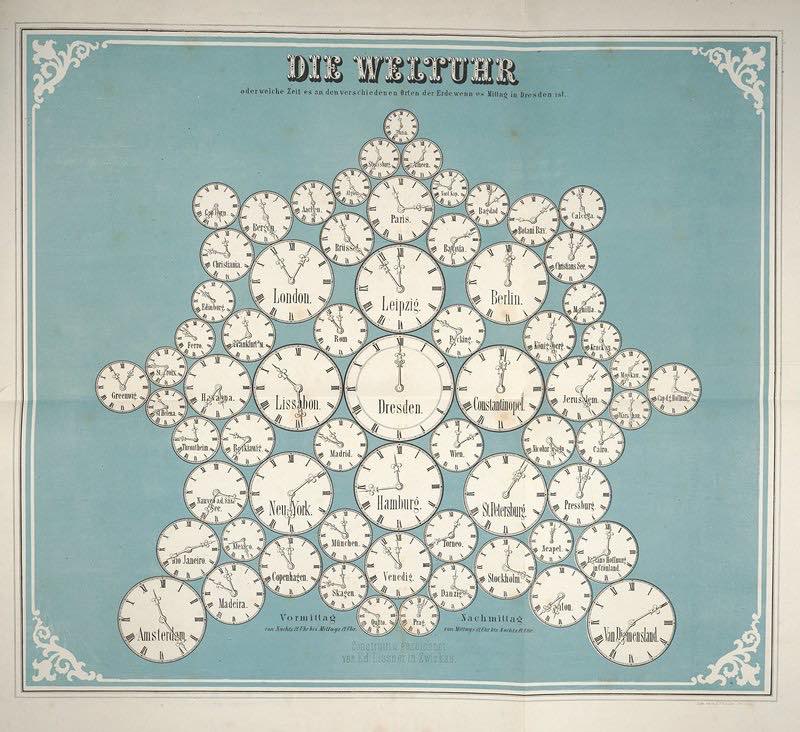
Below, “a snowflake of clocks illustrates world time zones, with Dresden at the center. ”
Peggy Barger liked this on Facebook.
Vaguely relevant. The von Humboldt’s don’t get enough credit. His brother Wilhelm was hugely influential universal schooling, philosophy, and on the role of government. Both cool dudes.
Kate Harris liked this on Facebook.